

LLM Application Tracing on OpenShift with the Red Hat Build of OpenTelemetry Operator (Capturing the Trace of an Agent Chatbot Example)
Author: Motohiro Abe
Disclaimer: This blog post is based on my personal experiments and learning.
The approaches and configurations shared here might not be the most efficient or best practices, but I hope they provide insight into exploring this area.
In this blog post, I’ll walk you through the OpenTelemetry Operator configuration setup on OpenShift, enabling distributed tracing to capture LLM messages from a chatbot application.
TL;DR -- the Demo
Deploying Opentelemetry collector supporting Multitenancy and Capturing traces from Adaptive RAG chatbot.
Watch the demo here:
Why Do this?
When experimenting with LLM applications — especially agentic applications — each agent handles prompts, triggers different transactions, and calls various tools.
For monitoring purposes, for example, such as LangSmith API can help track LLM applications, but OpenShift’s observability features enhanced with the OpenTelemetry Operator offer another approach - especially if the service is on-premise.
In this example, I’ll use OpenLIT auto-instrumentation. I’m just starting this journey, so I might not be doing things in the most efficient way yet, but I’m eager to explore and learn more in this area.
What Will I Cover?
- Setting up OpenTelemetry distributed tracing in OpenShift
- Calling OpenLIT from OpenShift AI Workbench
- Configuring OpenTelemetry distributed tracing with multitenancy
- Running an Adaptive RAG Agent Chatbot
- Demo recording
Setup OpenTelemery distriubted tracing in Openshift
In this first example, we’ll set up the OpenTelemetry Collector in the namespace where the application runs. For the LLM running with Python's OpenLIT library, the HTTP OTLP endpoint will be used in the collector.
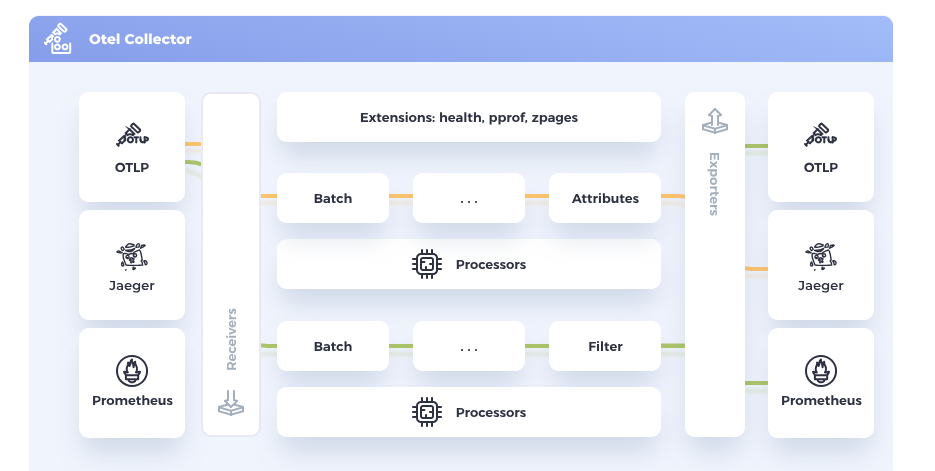
Image source: OpenTelemetry
The OpenTelemetry Collector will bridge our application and the tracing tool through receivers and exporters.
For multi-tenancy configuration, I will add a routing table in the processor configuration of the OTEL collector later.
Install OpenTelemetry Operator
Follow these steps in the product documentation:
-
Go to Operators → OperatorHub and search for Red Hat Build of OpenTelemetry Operator.
-
Select the operator provided by Red Hat → Install → View Operator.
OpenTelemetry collector setup
Here is the collector configuration for simple tracing. HTTP is specified in receivers to capture tracing from auto-instrumented Python applications. In the exporter section, it has the Tempo distributor endpoint where the TempoStack, which provides the Jaeger UI, is working. We will set up TempoStack next.
apiVersion: opentelemetry.io/v1beta1
kind: OpenTelemetryCollector
metadata:
  name: otel
  namespace: otel-demo
spec:
  config:
    receivers:
      otlp:
        protocols:
          grpc: {}
          http: {}
    processors:
      batch: {}
    exporters:
      otlp:
        endpoint: "tempo-simplest-distributor.otel-demo.svc.cluster.local:4317"
        tls:
          insecure: true
    service:
      pipelines:
        traces:
          receivers: [otlp]
          processors: [batch]
          exporters: [otlp]
Here is the TempoStack config:
apiVersion: tempo.grafana.com/v1alpha1
kind: TempoStack
metadata:
  name: simplest
  namespace: otel-demo
spec:
  storageSize: 1Gi
  storage:
    secret:
      name: minio-test
      type: s3
  template:
    queryFrontend:
      jaegerQuery:
        enabled: true
        ingress:
          route:
            termination: edge
          type: route
TempoStack requires object storage. I used MinIO for storage. Please refer to the MinIO setup documentation.
After deploying these YAML files, you should be able to access the Jaeger GUI. You can find the URL in the OpenShift Console under Networking → Route in the namespace where TempoStack is deployed (e.g., otel-demo).
Calling OpenLIT from OpenShift AI Workbench
Create an Openshift AI workbench in the namespace where you configured TempoStack and the OpenTelemetry Collector.
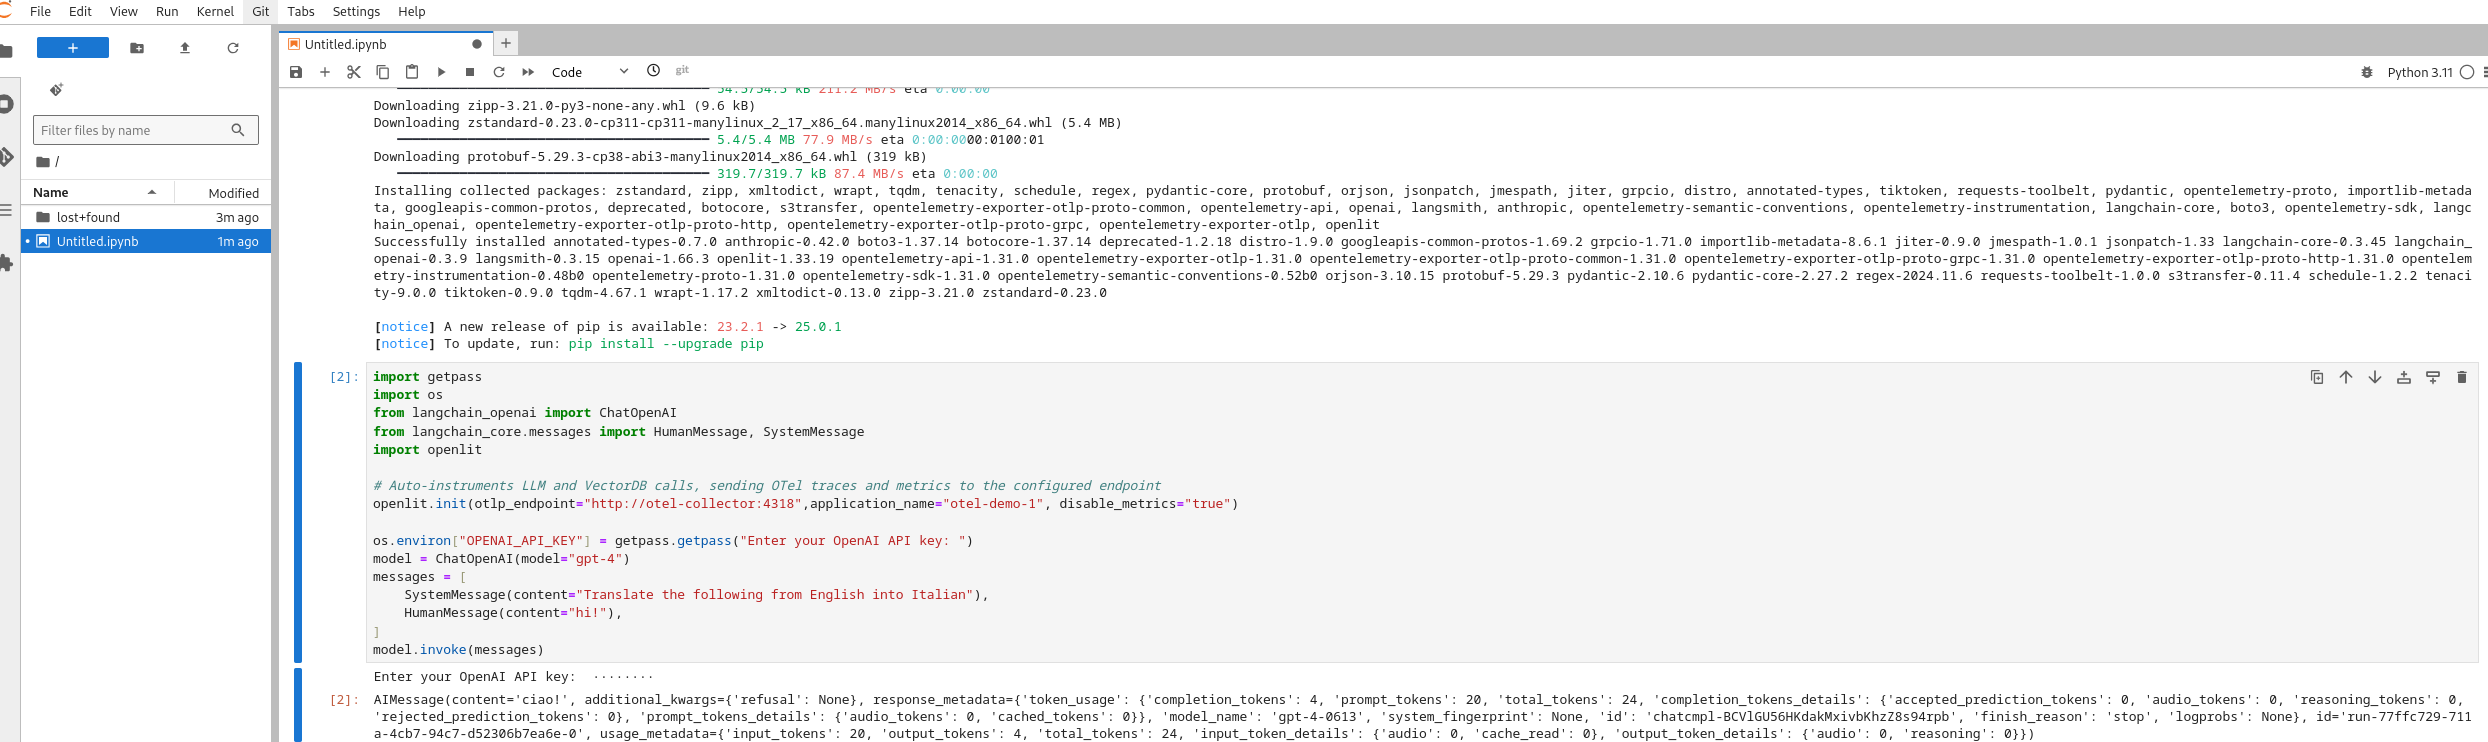
Here is a snippet from a simple notebook to run the LLM query and send the trace to the collector:
import getpass
import os
from langchain_openai import ChatOpenAI
from langchain_core.messages import HumanMessage, SystemMessage

# Auto-instruments LLM and VectorDB calls, sending OTel traces and metrics to the configured endpoint
import openlit
openlit.init(otlp_endpoint="http://cluster-collector-collector:4318",disable_metrics="true")

os.environ["OPENAI_API_KEY"] = getpass.getpass("Enter your OpenAI API key: ")
model = ChatOpenAI(model="gpt-4-mini")
messages = [
    SystemMessage(content="Translate the following from English into Italian"),
    HumanMessage(content="hi!"),
]
model.invoke(messages)
Only two lines are required to use OpenLIT (refer to the OpenLIT documentation). The otlp_endpoint points to the OpenTelemetry Collector.
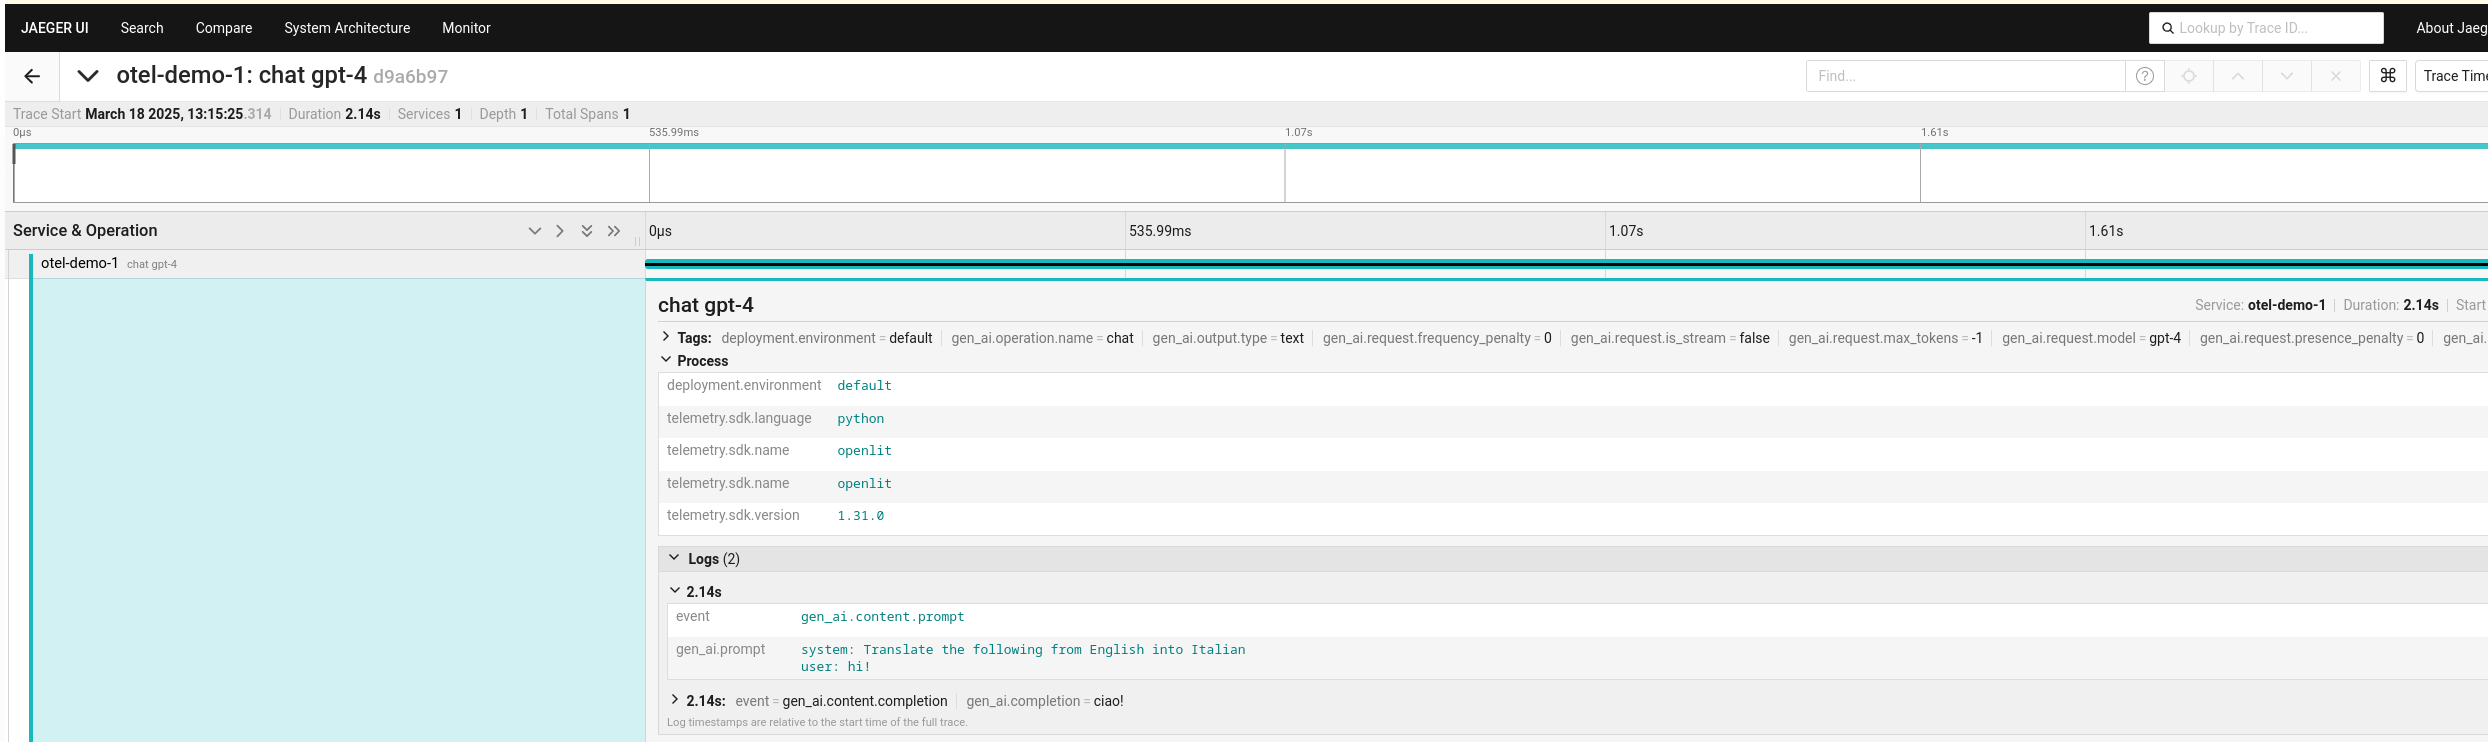
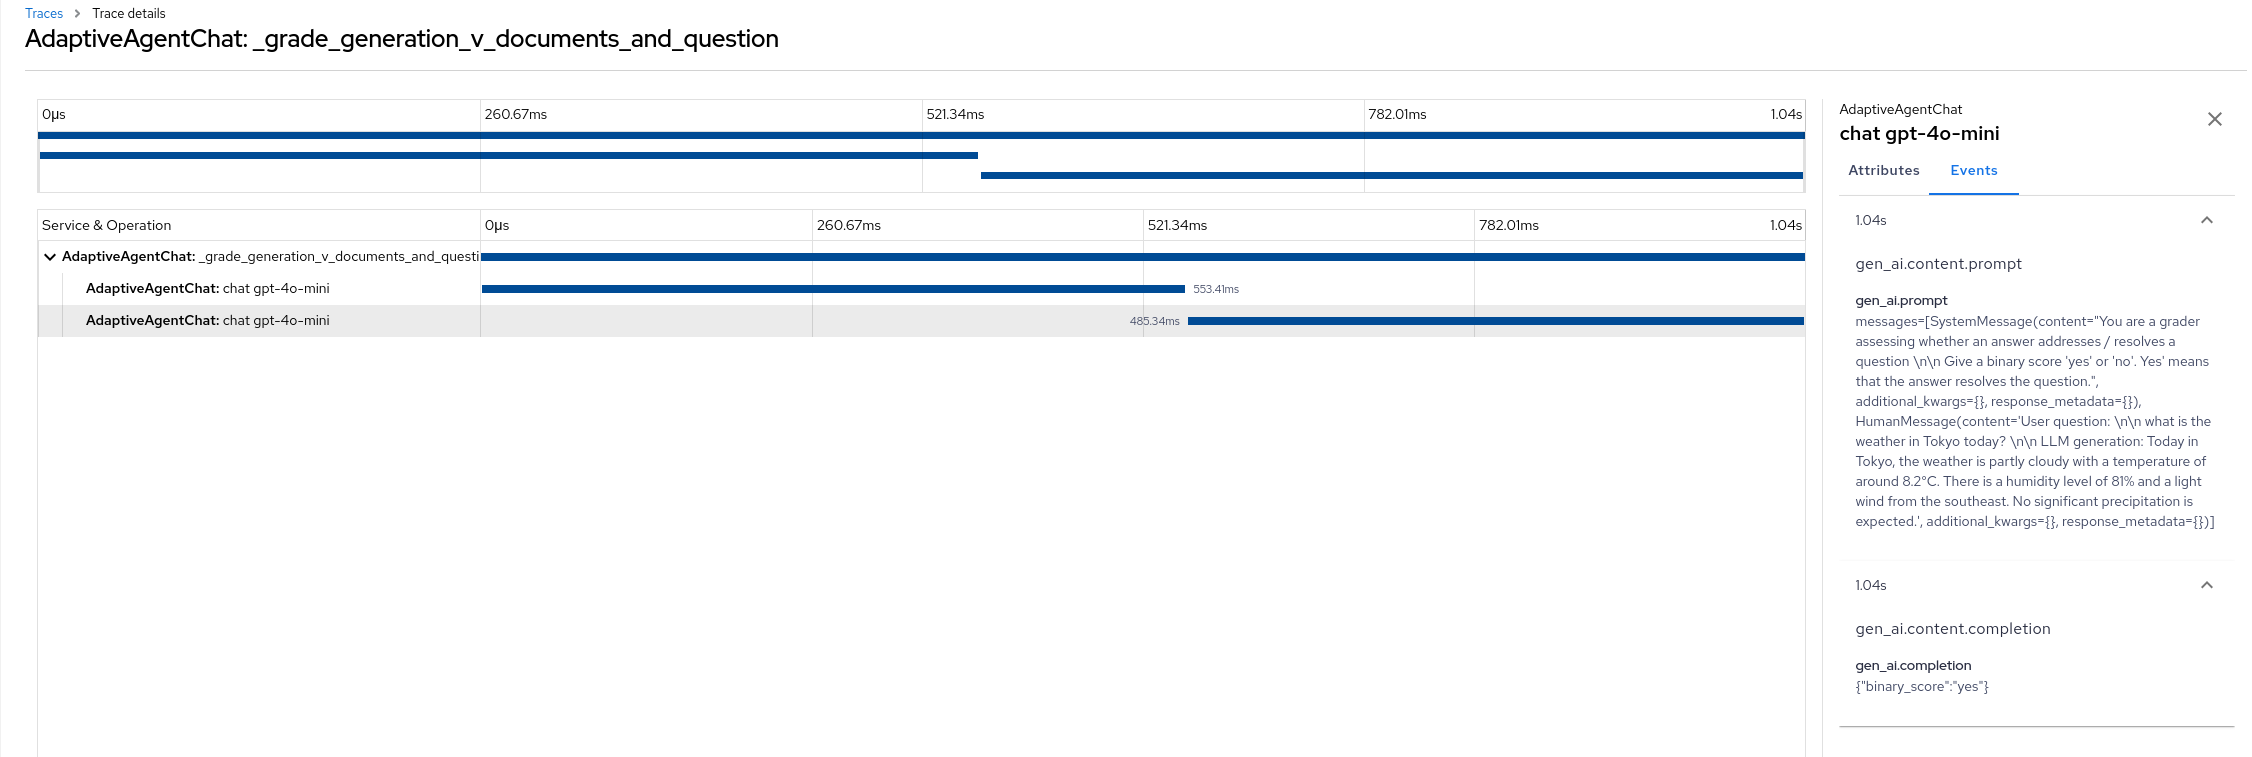
After running the notebook, check the Jaeger UI. You should see the traces to the LLM. It can capture the LLM prompt and its answer with latency.
Configuring OpenTelemetry Distributed Tracing with Multitenancy
Enabling the distributed tracing UI Plugin
The OpenShift Observability Operator comes with the distributed tracing plugin, adding a tracing menu to the OpenShift web console. This provides a unified view for tracing without needing to open individual Jaeger UIs as a cluster admin.
-
Install Openshift Observaiblity Operator
Follow the product documentation. -
Install the distributed tracing UI plugin
After successfully installing the Observability Operator, apply the following YAML:
apiVersion: observability.openshift.io/v1alpha1
kind: UIPlugin
metadata:
  name: distributed-tracing
spec:
  type: DistributedTracing
You should now see an Observe → Traces menu in the Administrator perspective of the OpenShift web console.
Configure Multitenancy
Assuming we have two projects (tenants), otel-demo-1 and otel-demo-2, follow the documentation to create the service accounts, ClusterRole, and ClusterRoleBinding for TempoStack and OpenTelemetry Collector.
For multitenancy and using the distributed tracing UI, we need to route the traffic to individual exporters. Here is the routing configuration snippet of the collector that worked for me. The complete YAML files can be found in the github repo.
      processors:
        routing:
          from_attribute: k8s.namespace.name
          attribute_source: resource
          default_exporters: [debug]
          table:
          - value: "otel-demo-1"
            exporters:
            - otlp/otel-demo-1
          - value: "otel-demo-2"
            exporters:
            - otlp/otel-demo-2
After instantiating TempoStack and the OpenTelemetry collector, we are ready to send traces from the application.
Running an Adaptive RAG Agent Chatbot
"Adaptive RAG is a strategy for RAG that unites (1) query analysis with (2) active / self-corrective RAG."
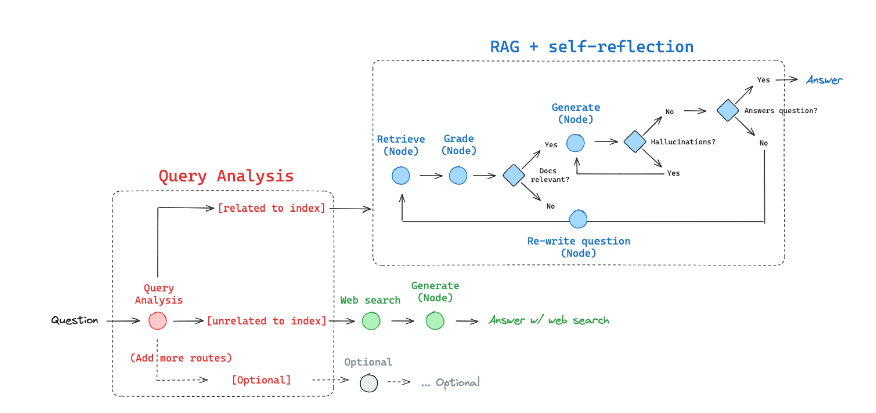
Image source: LangGraph
For my fun and study purposes, I ported the Adaptive RAG to a chatbot with a Slack interface and ran it from one of the namespaces specified in the otel-collector.
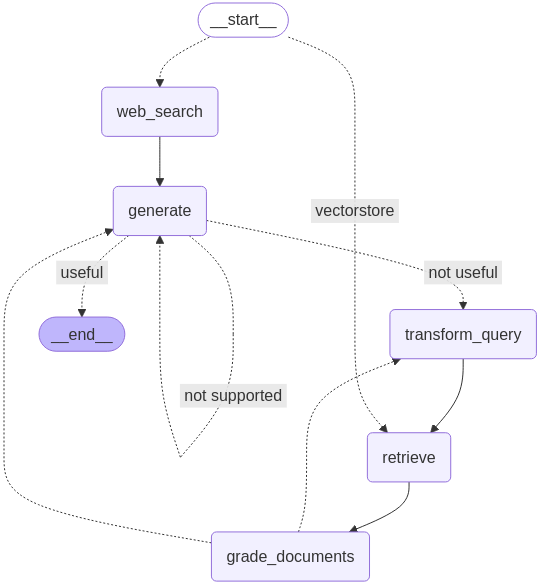
In Adaptive RAG, we have query analysis and a grader that evaluates the relevance of the retrieved documentation, tries to avoid hallucination, and then grades the final answer. With the LangGraph tutorial, we have five nodes, and it becomes pretty complicated once the application runs. Let’s capture the transaction.
In the Python code, here are the only two lines you need to add for OpenLIT integration:
import openlit

openlit.init(application_name="AdaptiveAgentChat",disable_metrics=True)
To hit the routing in the otel-collector, I provided the OTEL_RESOURCE_ATTRIBUTES environmental value, along with other parameters such as OTEL_EXPORTER_OTLP_ENDPOINT, in the deployment.yaml.
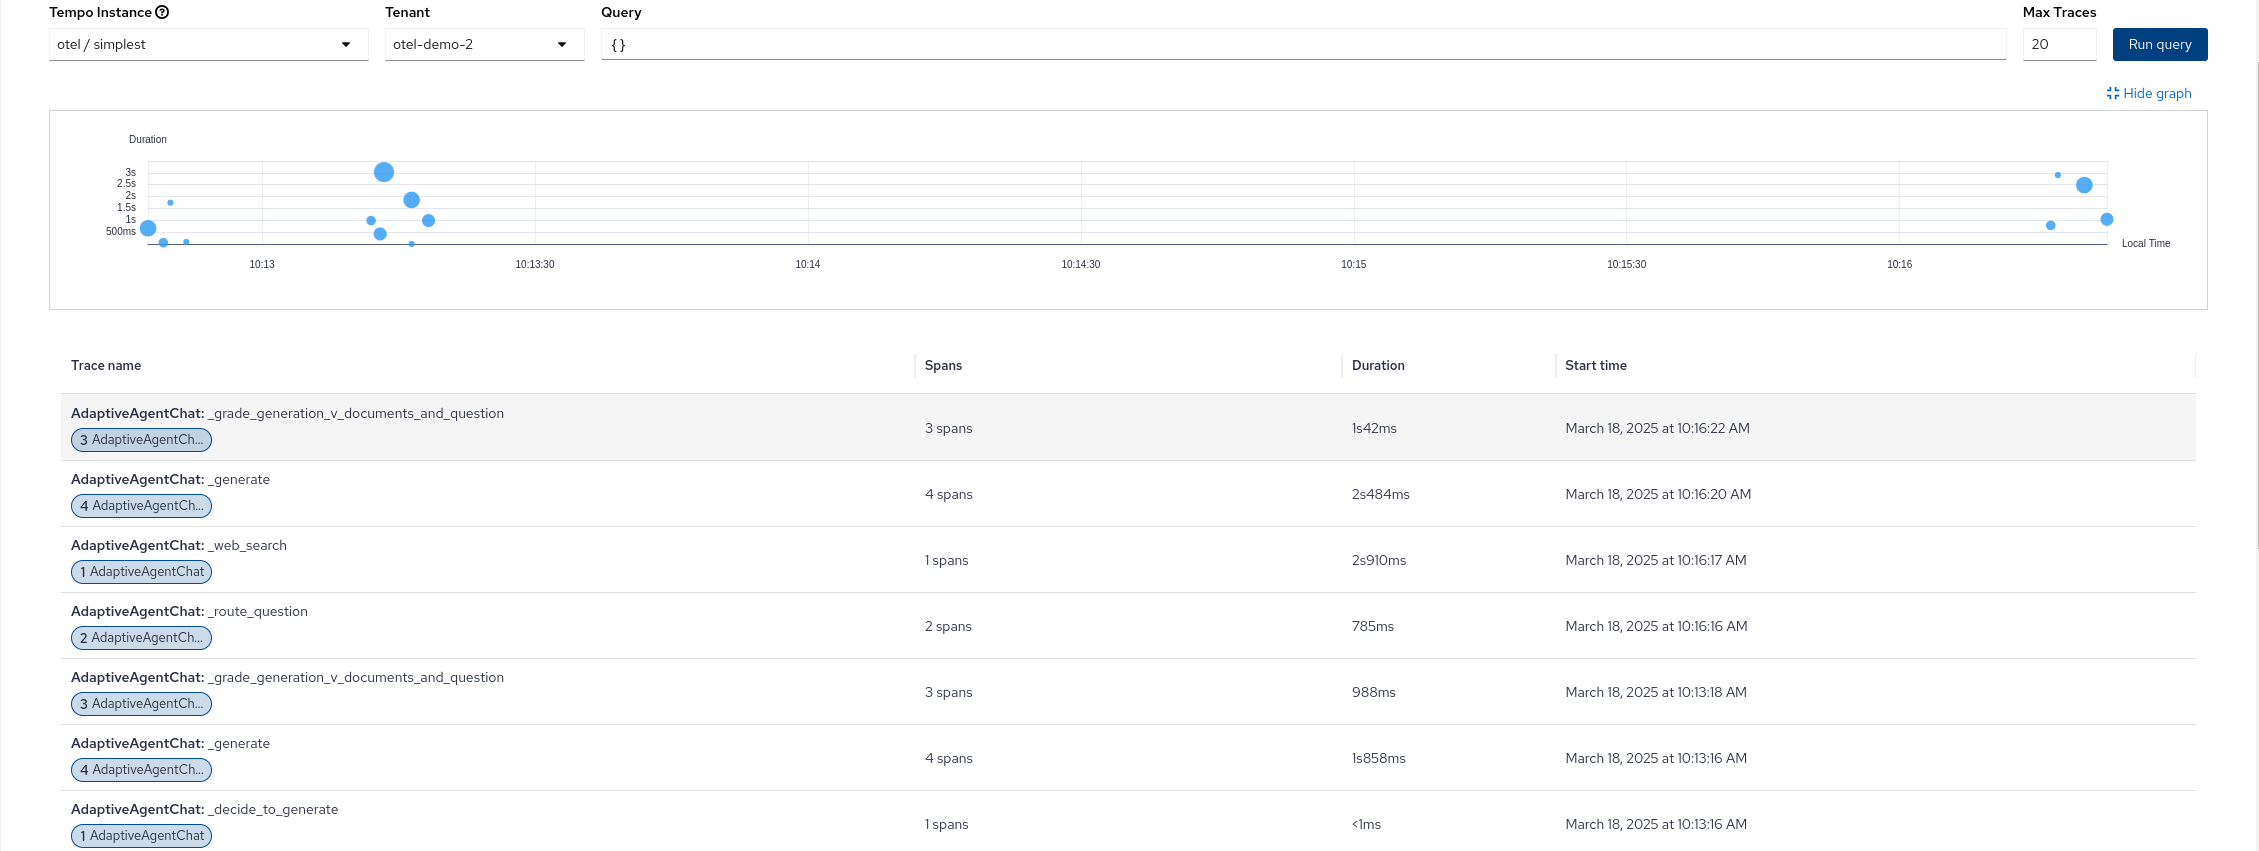
About the demo
I demonstrated the deployment of TempoStack and the collector with multitenancy, then deploy the agent chatbot and show the trace.
I tried using the manual tracing function. By using openlit.trace, I added the decorator to each method in the agent to group LLM functions and organize them.
    @openlit.trace
    def _retrieve(self, state):
        """
        Retrieve documents

        Args:
            state (dict): The current graph state

        Returns:
            state (dict): New key added to state, documents, that contains retrieved documents
        """
        logger.info("---RETRIEVE---")
        question = state["question"]

        # Retrieval
        documents = self.retriever.invoke(question)
        return {"documents": documents, "question": question}
References
I have used and referenced these codes and procedures:
- 西見 公宏,吉田 真吾,大嶋 勇樹 LangChainとLangGraphによるRAG・AIエージェント[実践]入門.
- OpenLIT
- LangGraph
Then, all yamls and code can be found here. github.